Practice · Food delivery
Avo House
A practice admin dashboard for a food-delivery business: sales, live orders, branches, drivers and the menu, in one calm desktop tool.
Contents · Overview
Overview
Avo House is a practice design for the back office of a food-delivery business — the screens its staff would use to run the day, not the ones customers order from. It was designed in Figma on one board of desktop frames, with no client and no build.
An admin signs in and lands on a dashboard; from a fixed sidebar they move between Orders, Restaurants, Products and Drivers. Branches are named after Lagos neighbourhoods — Ikoyi, Victoria Island, Lekki — and every number in the frames is sample data. Open the Figma file to see the whole board.
Challenge
Earlier write-ups described Avo House as a customer storefront — appetising imagery, dietary filters and a cart side-panel. The Figma file is the other side of the counter: an admin dashboard for the business. This case study describes what the frames actually show.
the real problem
Four moving parts, one screen.
Whoever runs a delivery business juggles four things at once: orders coming in, branches opening and closing, drivers out on the road, and a menu that changes. The challenge was to keep all four visible and editable without the admin losing their place.
The appetising photography from the brief survives, but inside a calm grey-and-white tool: burger cut-outs on product cards, dining rooms on branch cards.
Goals
goals, as the frames express them
The day at a glance. Sales, order counts, the current offer and the drivers on one dashboard.
Any order, fast. A full table with search, an ETA sort, a status on every row and a phone icon for the driver.
Know where everyone is. Branches and drivers on a dark map; a driver’s current delivery drawn as a route.
Edit in place. Details and new products open in a side panel over the list, so the admin never leaves it.
Close the day. “Send daily report” sits under the sidebar on every screen.
Research & discovery
Avo House was a practice project, so there was no research with a real business behind it. The work started from the standard shape of an operations dashboard — a summary first, then one page for each thing being managed — and from listing what a delivery business actually runs on.
Read back from the frames, the dashboard holds six kinds of record, and every page is built around one of them:
What the dashboard manages
- Restaurant — A branch: address, opening hours, open or closed, phone, email, a pin on the map.
- Product — Name, ingredients, vegan or not, weight, calories, price, photo, category (Main courses, Side dishes, Drinks, Others), shown or hidden.
- Order — Restaurant, items, order ID, client, delivery address, value, ETA, driver, status.
- Driver — Status (delivered, in delivery, idle), current delivery, deliveries so far, vehicle.
- Client — A name and a delivery address, as they appear on the order.
- Vehicle — Model, plate and condition — for example a Vespa Elegante 150 marked “Good condition”.
Information architecture & flows
The sidebar is the whole map: Dashboard, Orders (with a count badge), Restaurants, Products and Drivers. It never moves, and neither do the search bar, the Export button or “Send daily report”; only the main area changes. One variant of the orders table collapses the sidebar to icons.
Sitemap
- Sign in — “Admin Dashboard”: email and password, or Request access for new staff.
- Dashboard
- Orders — The full table; a selected row is outlined in teal.
- Restaurants — Branch cards and a map; a filter for open branches only.
- Products — Tabs: Main courses, Side dishes, Drinks, Others.
- Drivers — Tabs: Driver list and Vehicle list (only the driver list is drawn).
- Add product panel
- Driver details panel
Order lifecycle
- Ordered — Grey dot.
- Pending — Amber dot.
- In-delivery — Lime dot, with an ETA.
- Delivered — Green dot; the ETA column shows a dash.
Wireframes
playground
Blocked out first.
The board starts with a frame called Playground: the dashboard as grey blocks — a sidebar, a top bar, three panels across, two stacked on the right, and one wide panel underneath — before any content goes in.
The finished dashboard keeps the idea — a fixed sidebar, a search bar and a grid of white panels on grey — and rearranges the panels around the content: sales and orders on the left; the offer, drivers and map on the right.
Visual design & system
The interface is grey and white with one teal for actions, so the food photography and the status dots carry the colour. Status is never colour alone: every dot sits next to its word.
Off to the side of the board are size squares (8, 16, 24, 32, 36, 40, 48 and 64 px) and a hidden frame named “Competents” holding the parts the screens reuse — six driver avatars, the logo, a scooter and a car — plus a strip of burger photos. There are no shared colour styles, text styles or components in the file; values are set on each layer.
Orders 126 · $65,436 this month
The only typeface. Medium for table text and labels; Semi Bold to Extra Bold for headings and figures.
Key screens
Dashboard
The day in one view: a sales curve with today, this month and this year beside it; order counts (ongoing, delivered, total); the latest orders with ETAs and a phone icon; the current offer; and which drivers are delivering and who is on a break.
Orders
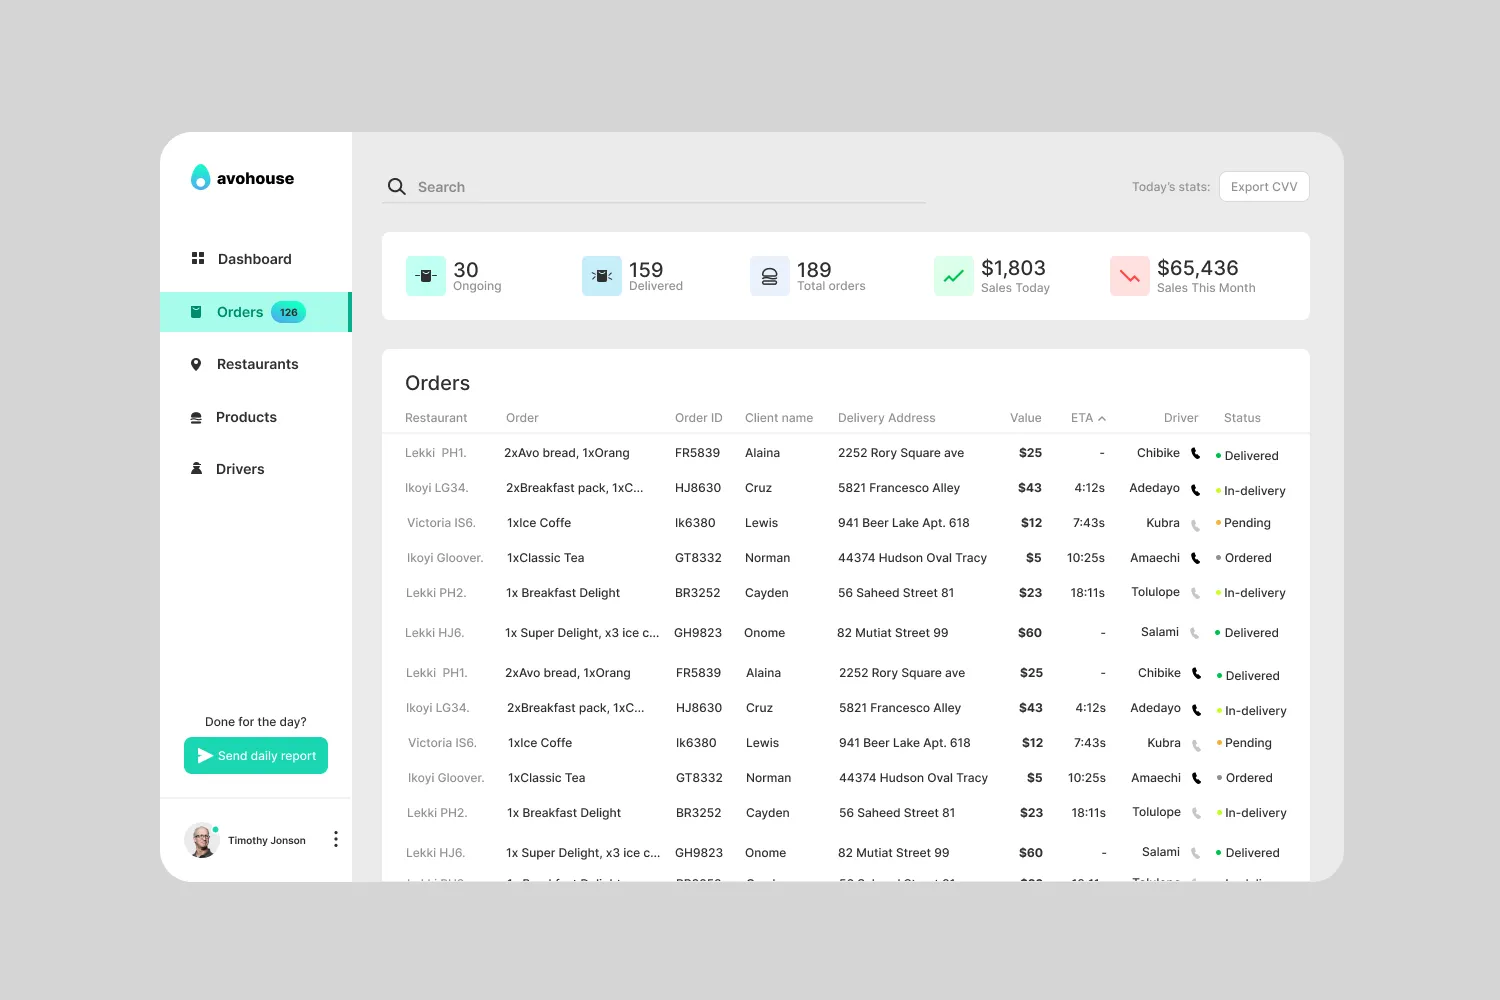
The full table adds client, delivery address, driver and status. The summary strip stays on top, the ETA column carries the sort arrow, and a separate frame shows a selected row outlined in teal.
Restaurants
Branch cards — photo, address, hours, Manage restaurant, call and email — sit beside a dark map with a pin for each branch. A closed branch is labelled “Closed”, with a grey marker in place of the teal one; a checkbox narrows the map to open branches.
Drivers
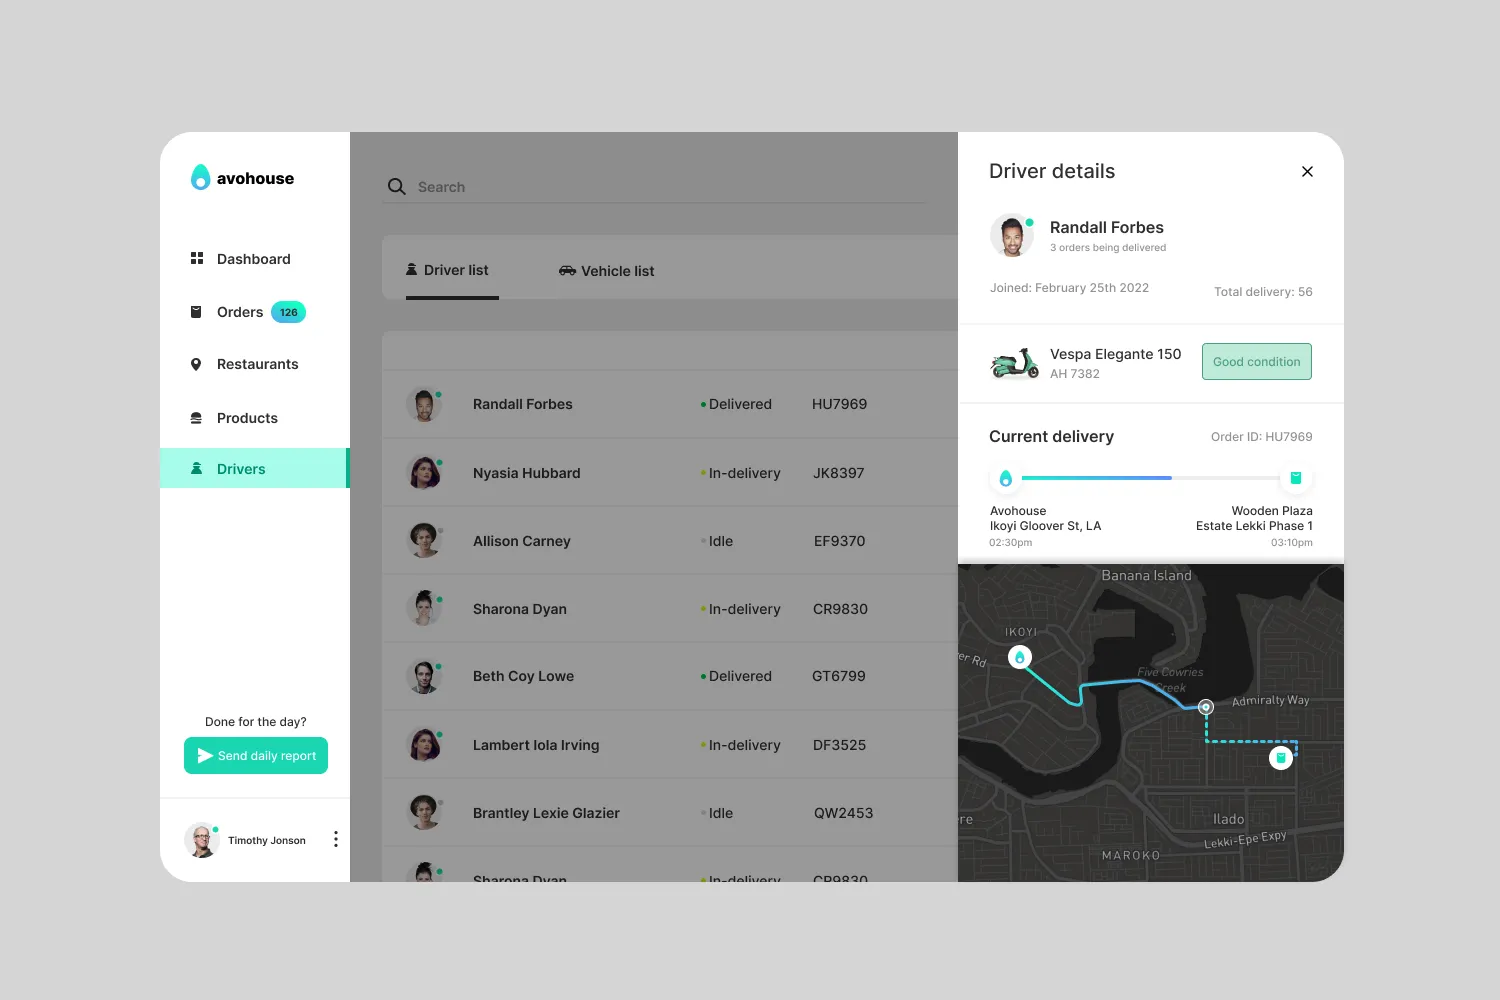
The driver list shows each driver’s status, current delivery, deliveries so far and vehicle. Opening a driver slides a panel over the list: when they joined, their vehicle and its condition, and the current delivery as a route on the map, from branch to doorstep.
- 1Count badge
The Orders item carries a count badge on every page.
- 2Export
Exports today’s stats. The label reads “CVV”; it should read CSV.
- 3Summary strip
Order counts and sales stay above the table.
- 4Sort by ETA
The ETA column carries the sort arrow.
- 5Status
A coloured dot and a word: delivered, in-delivery, pending or ordered.
- 6Close the day
“Send daily report” is under the sidebar on every page.
Editing in place
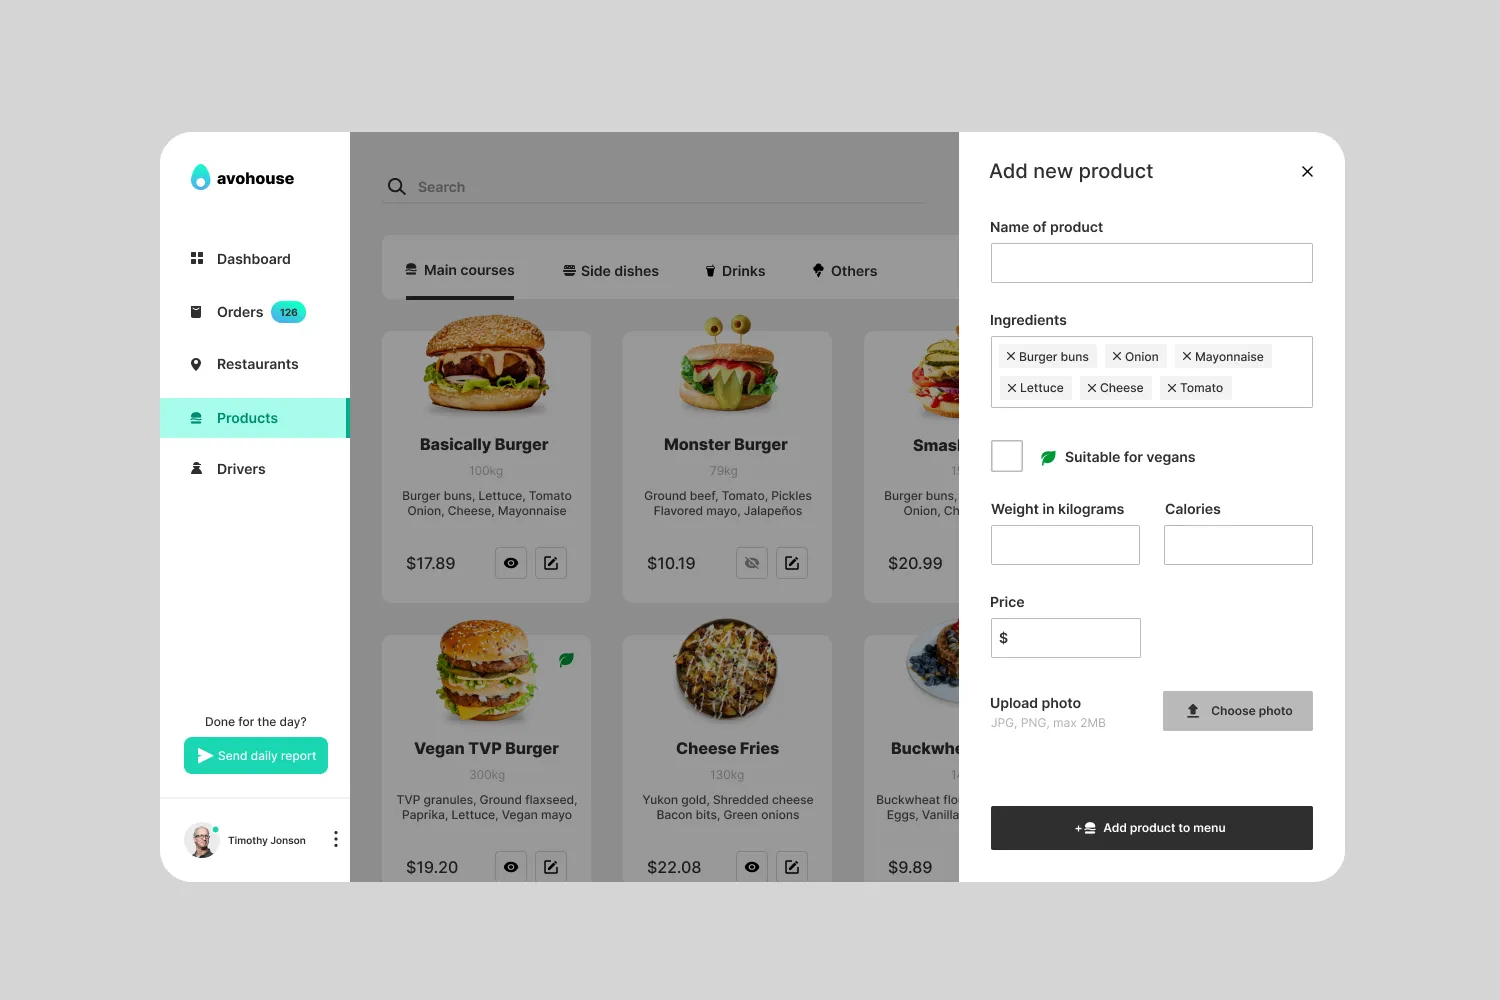
Anything with detail opens as a panel from the right, over a dimmed list, instead of a new page — the same pattern for reading about a driver and for adding a product. Drag the slider to compare the two.
 Driver details
Add product
Adding a product
- Products — Tabs by category; each card has an eye icon (struck through on one product, so a show/hide toggle) and an edit button.
- Add new products — The last tile in the grid.
- Fill in the panel — Name, ingredients as removable chips, the vegan flag, weight, calories, price, and a photo (JPG or PNG, max 2 MB).
- Add product to menu
- New card in the grid
Outcome & learnings
Avo House is a design exercise: thirteen frames on one Figma board, not built and not tested with a real business. It covers signing in, the dashboard, orders, branches, the menu and drivers.
The lesson is in the gaps. The layout is consistent, but nothing is shared — no components, no colour styles — so every repeated row, card and panel was drawn by hand. That’s the first thing a next round would fix, before adding screens.
open, if it goes further
- Components and colour styles for the sidebar, table rows, status dots, cards and panels
- Screens behind buttons that exist: Manage restaurant, editing a product, the Vehicle list
- Empty, loading and error states (an order with no driver, a failed photo upload)
- A copy pass: “Export CVV” should read CSV
- A contrast check on the lime In-delivery dot against white